R, Python and Matlab all have POSIX fuctions that can be used to reformat dates and times. In it's integer for, they represent seconds from January 1, 1970. E.g., using as.POSIXct(1690000000) will return "2023-07-22 12:26:40" in R.
For example, in R using as.POSIXct(1690000000) will return "2023-07-22 12:26:40".
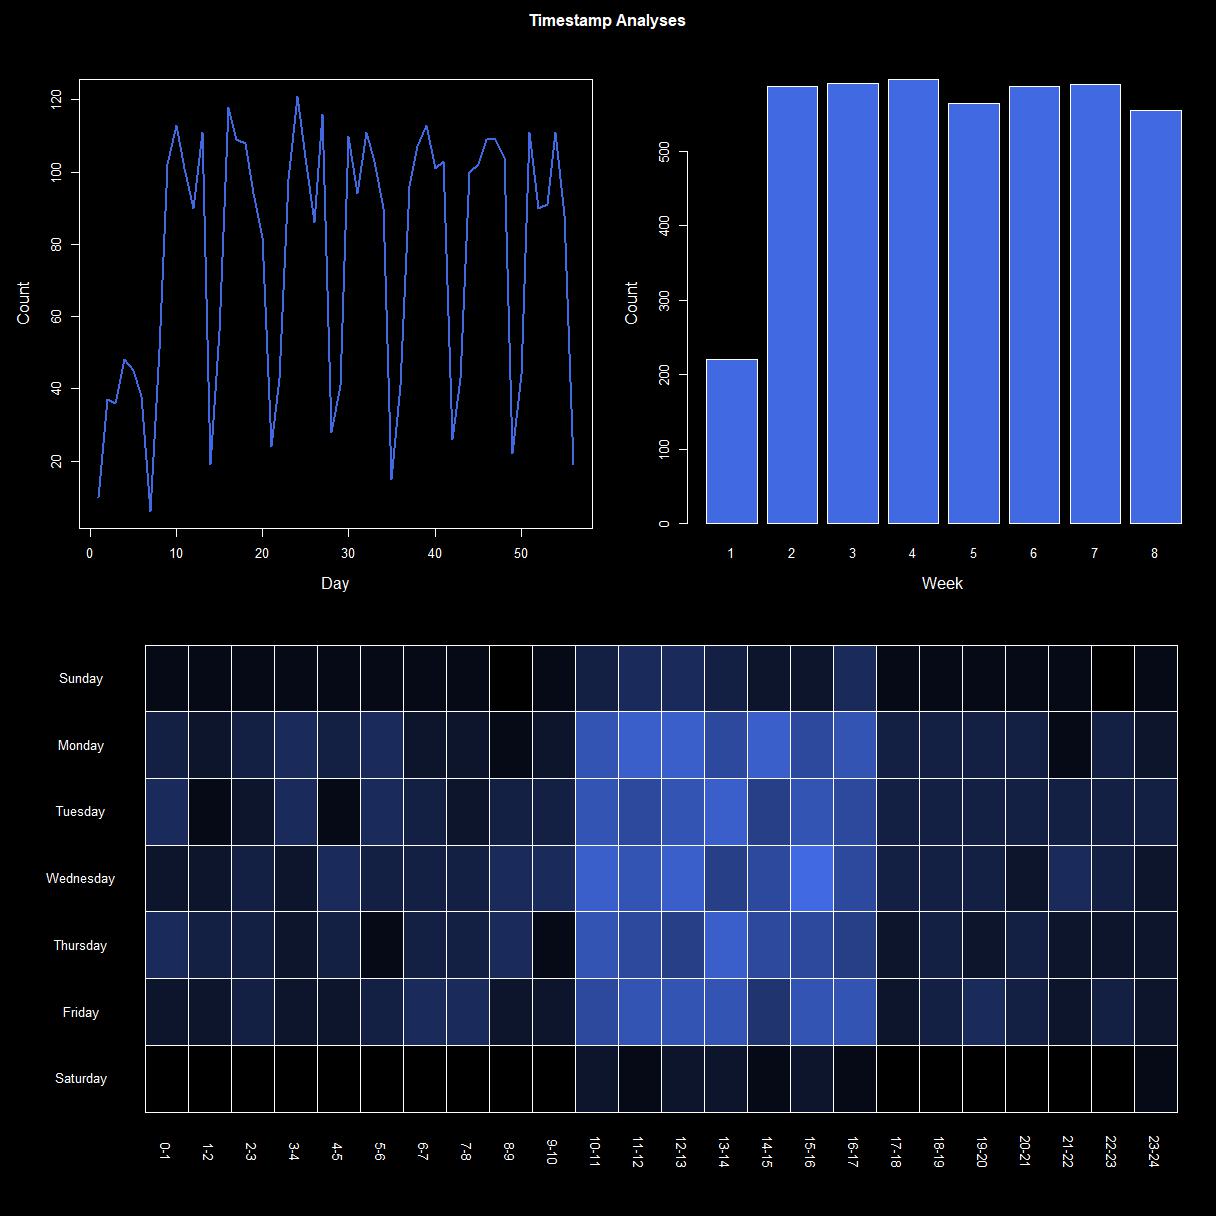
Let's pretend we have timestamps for an action or app use. What kind of analyses could we run on it? What data visualizations might be useful to spot trends? Maybe:
1) Amount of entries per day as a line plot?
2) Bar plot of sum per week?
3) Heatmap of hours vs. days of the week?
Why not all of that? In fact, why not build a "dashboard" that tells us all sorts of information?
Code used to simulate and visualise the data can be found here.
Of course, there is much more that can be done, but even this could tell us that, for example, that there is not much data for the weekends or out of office hours, and that it takes about 2 weeks for the counts to stabilise.