How do we use data to make recommendations of other options based on knowing an option that a user likes?
In this exercise we use the Jester data collected by Ken Goldberg.
Data consists of 100 jokes that are rated by users, on a scale from -10 to 10.
A simple way would be to calculate, for each option, the mean distance to other options.
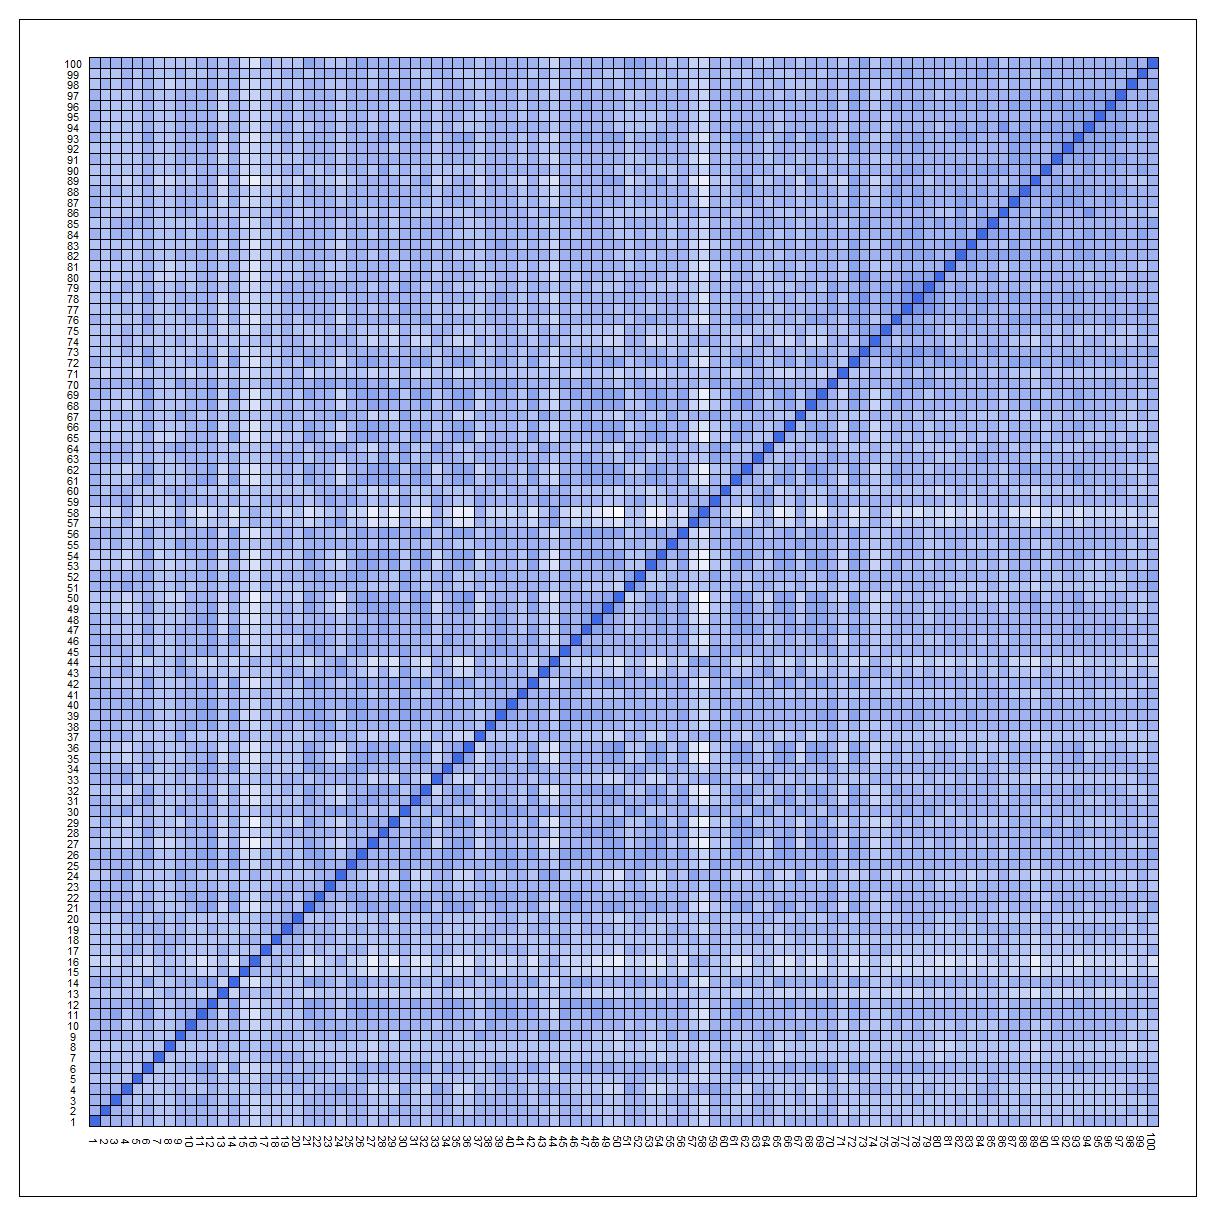
We can then compute a dissimilarity matrix, with 0 being things that are the nearest, and 1 being the things not similiar.
We can plot the result as such, just to visualization purposes.
Given this matrix, it is easy, for any given option/joke to select the n-best joke/options that have the least distance/ most similiar.
For example, option 14 is most similiar to option 26, by this metric.
The code used, including the one used for plotting, can be found here.
The above code should be general enough that it could translate to any type of data that has numerical ratings.
Of couse, this is a simplistic way to go about things and make many assumptions. People vary in personality and likings, and it would be better if one can break this down by demographics, for example.
Also, just because a joke is rated-similiarly does not mean that they are similiar.
Based on this we can go on to make other models or more complex ones, just as figuring out if there are joke/option clusters.