In one of my research papers (pdf), we used EEG to look at early visual processing in the brain.
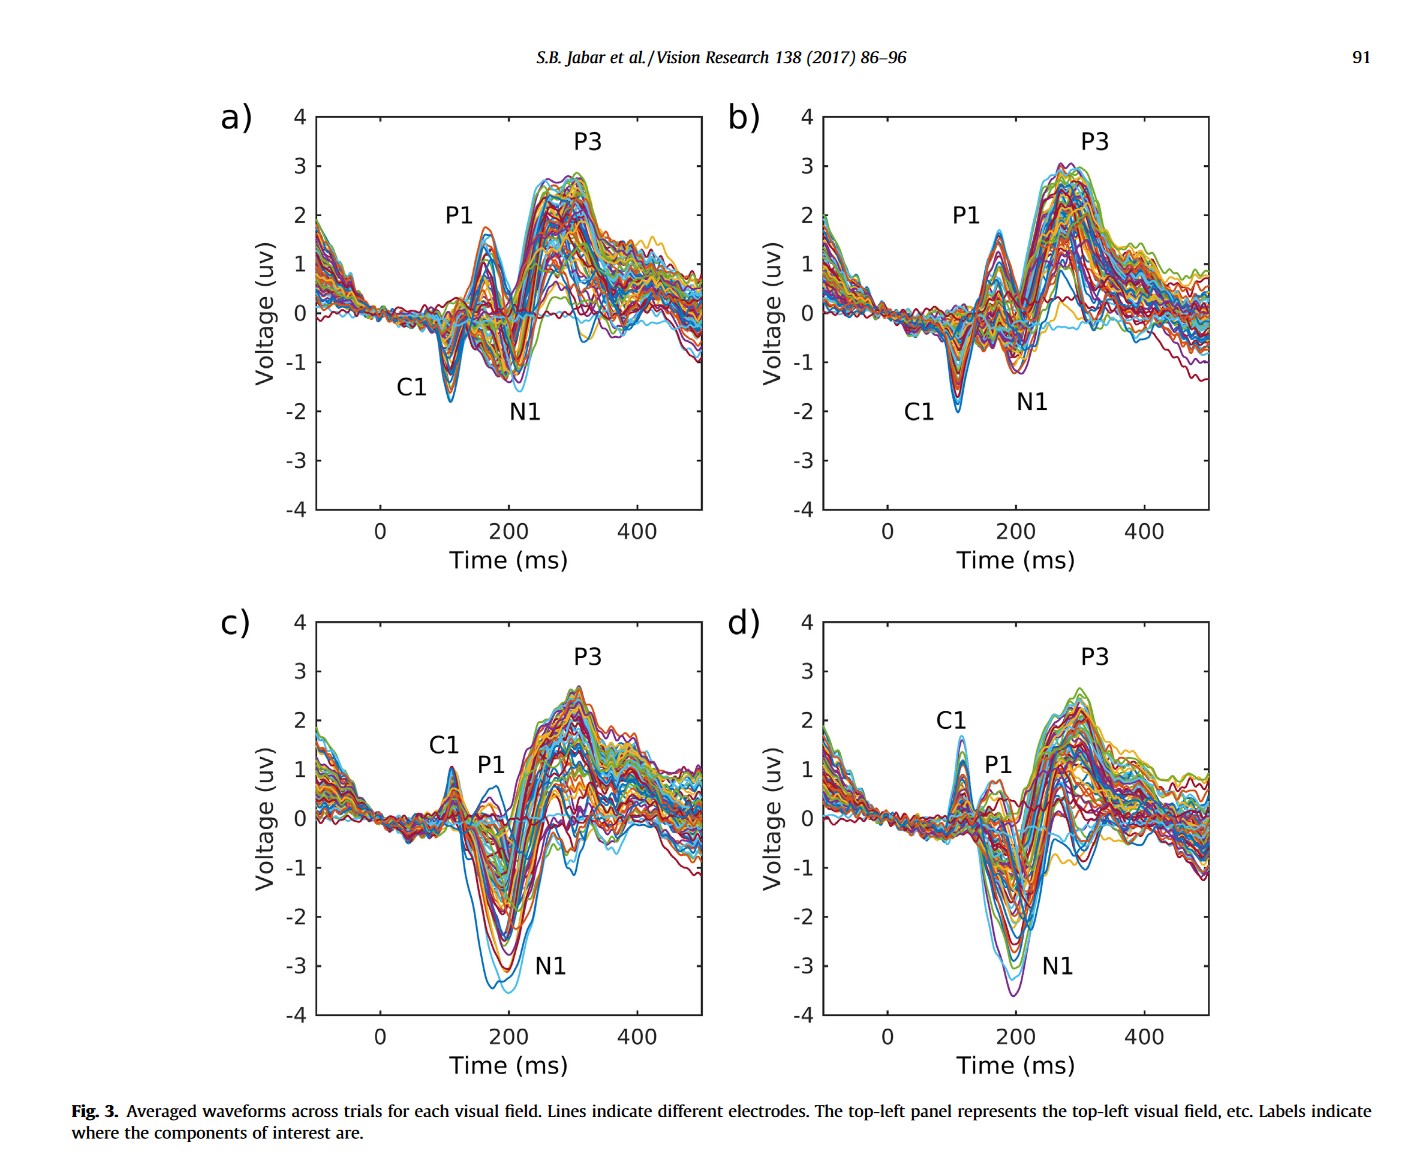
In EEG experiments you get figures like this. Unless you are very familiar with evoked potentials, they don't really tell you much about topography. But they tell you what is happening across time.
Using animations though, we plot the topography at each timepoint as a frame, and export a video.
Now we can scroll through the timeline and see where activity is seen on the scalp, depending on where in the visual field the stimulus was shown.
Code used to generate each frame in the video only required a minor modification to EEGLAB's (MATLAB) pop_topoplot() function and some creative use of MATLAB's plotting functions. Note that this was done in 2016, things may have changed then.